AFFILIFY.COM – My progress
For more pieces of advice and answers visit: https://help.affilify.com
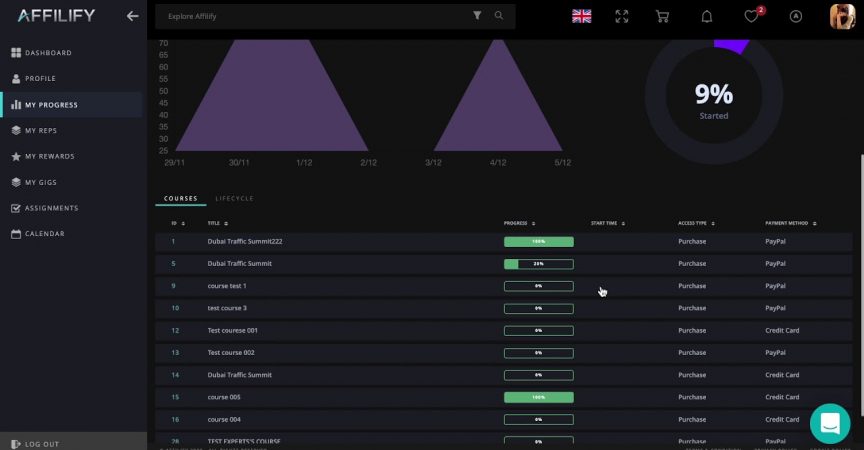
By clicking on the “My Progress” tab we will get a visualized main statistical data. On the top of the page, we have a count of courses, which are in progress, completed or not started, total training time, and obtained points. Below are an activity diagram, progress pie chart, and control options to manage displaying data. For example, to show data per week, month, or year. By scrolling down we will see two subtabs: courses and lifecycle.
Courses subtab contains the list of all courses the current user has been participated in and some corresponding data. The lifecycle tab displays a bit more metrics on how long you have been participating, the count of purchases, and gross sales. Here is also a list of courses with a status (passed or failed) and result details which you can get by clicking on the “View Results” button.
►Follow @affilify
Instagram: https://www.instagram.com/affilifyoff…
Facebook: https://www.facebook.com/affilify/
Community: https://www.facebook.com/groups/Affil…
Linkedin: https://www.linkedin.com/company/affi…
Tik Tok: https://vm.tiktok.com/Gy5xAQ/
Website: https://affilify.com


